Inspirational journeys
Follow the stories of academics and their research expeditions
Understanding Correlation vs. Autocorrelation in Data Science

For a data scientist, understanding correlation and autocorrelation is important as they serve different purposes in statistical analysis and signal processing. Here's a breakdown of the key differences:
1. Correlation:
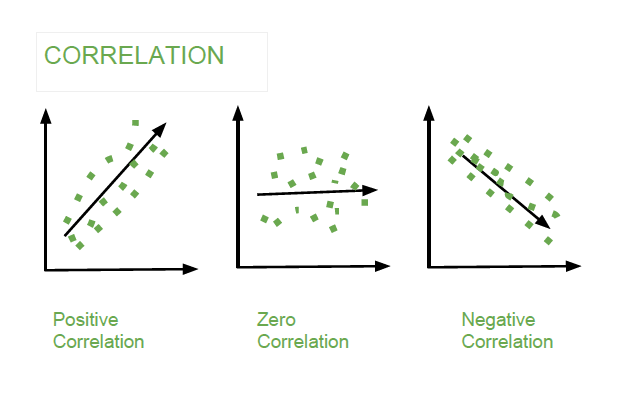
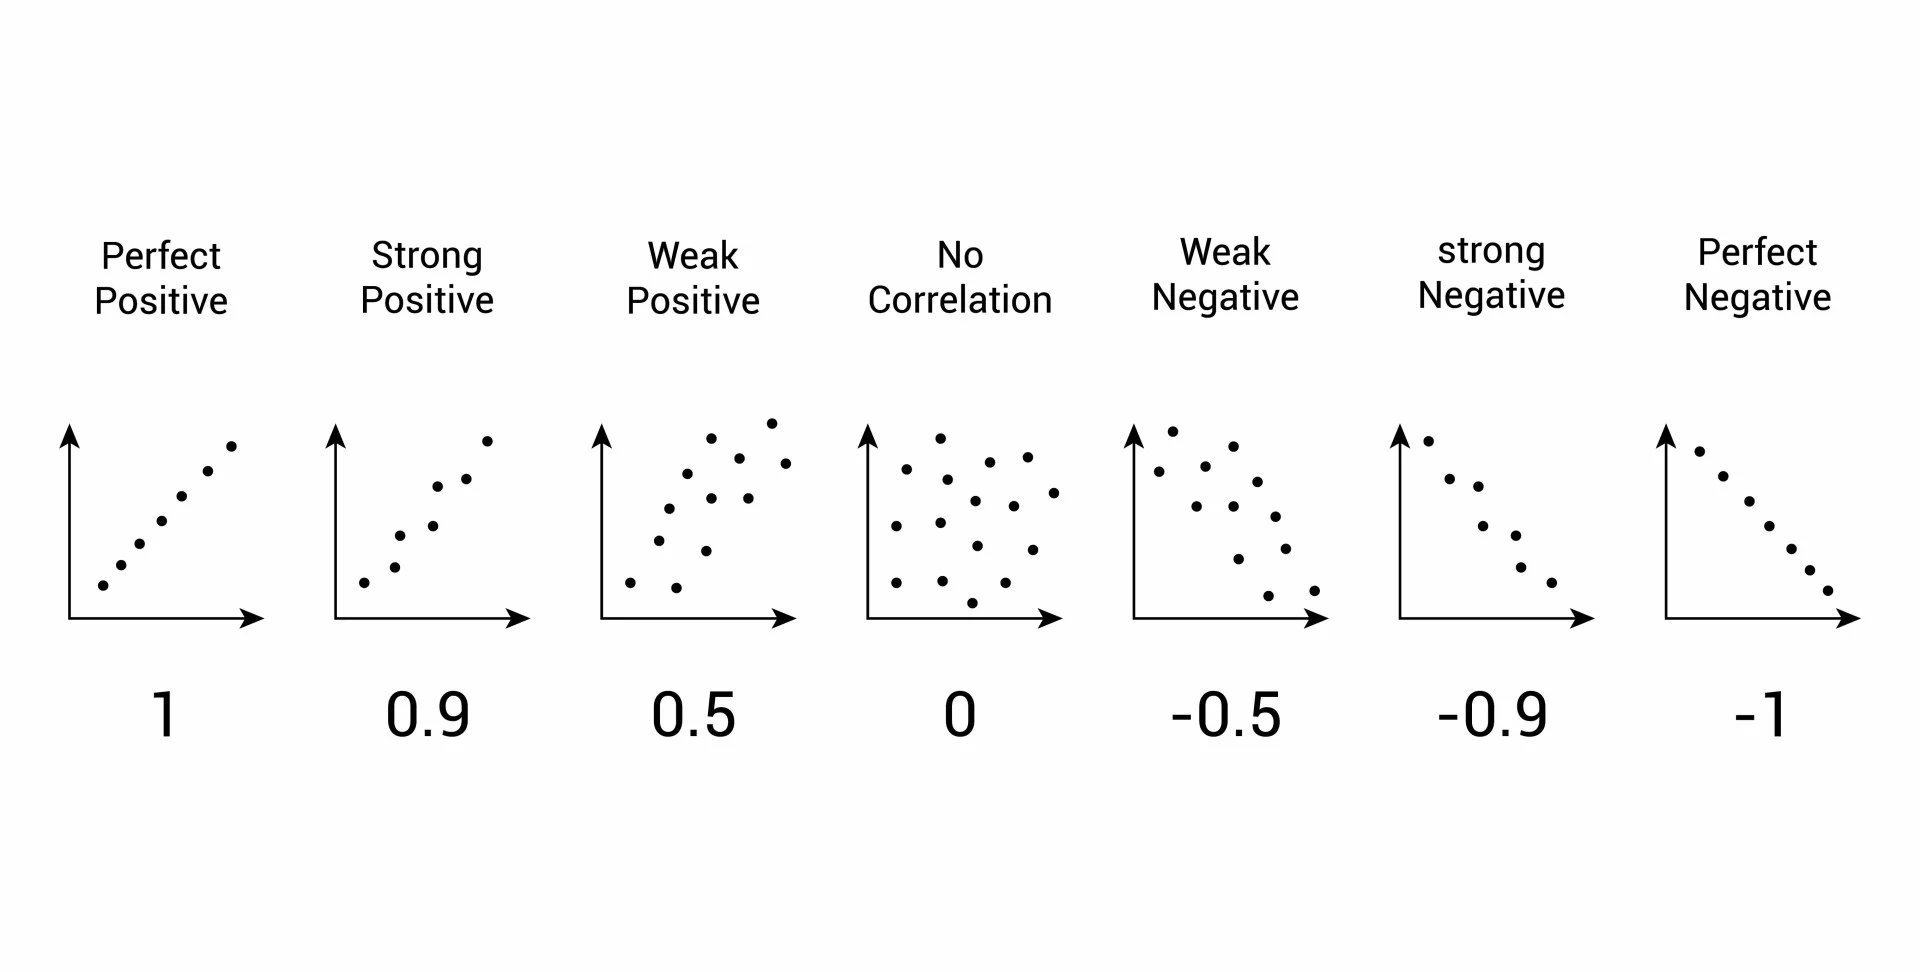
- Definition: Correlation refers to a statistical relationship between two different variables. It measures how much one variable changes with respect to another. The correlation coefficient (often Pearson’s) quantifies the strength and direction of this relationship, typically ranging from -1 (perfect negative correlation) to +1 (perfect positive correlation).
- Use Case: You use correlation to understand relationships between independent variables in datasets. For example, you might analyze the correlation between advertising spend and sales revenue.
- Purpose: Identifies linear relationships between two variables.
- Key Characteristic: The variables are distinct; you're analyzing the relationship between different variables in the dataset.
Example:
- How are hours of study (X) and exam score (Y) correlated?
2. Autocorrelation
- Definition: Autocorrelation (or serial correlation) measures the correlation of a variable with itself over successive time intervals. It quantifies how much the current value of a time series is related to its previous values at different time lags.
- Use Case: Autocorrelation is commonly used in time series analysis to understand patterns over time, such as in stock prices or weather patterns. It helps identify seasonality, trends, or persistence in data.
- Purpose: Helps uncover temporal dependencies in a single variable over time.
- Key Characteristic: The same variable is analyzed at different points in time (lags).
Example:
- How is the stock price today related to its price 1 week ago, 2 weeks ago, and so on?
Key Differences:
Feature
| Correlation
| Autocorrelation
|
Definition
| Relationship between two different variables
| Relationship between the same variable over time
|
Data type
| Used for cross-sectional data
| Used for time series data
|
Variables
| Compares different variables (X and Y)
| Compares the same variable with itself (at lags)
|
Use Case
| Studying dependencies between variables
| Studying persistence and time-related patterns
|
Purpose
| Measures how one variable changes with another
| Measures how past values affect future values
|
In practice, both concepts are widely used but in different contexts. Correlation is more applicable for static datasets, whereas autocorrelation is key for analyzing dynamic, time-based datasets like financial data or weather trends.
0 Comments


Leave a comment